Microsoft Dynamics GP Troubleshooting
Sometimes things go wrong. Is it something you can resolve yourself, or do you need expert help? Where do you start? There are as many troubleshooting techniques as there are unique problems. Here we provide some basic steps that can always be used to start the process, in the order they should be performed.
Basics
What Did I Just Do?
The moment you get an unusual error, stop. Take a moment to take some notes about what just happened. Take a “history” of the incident, recording as much pertinent information as you can recall, without touching GP.
- What was the document number/customer number/item number/etc?
- What were the last few things you did in GP prior to the error? Be specific. Which buttons, which fields, etc?
- Record the Date/Time. This is important because it could correspond to something else occurring on the computer/network at the same time.
Screen Capture
Make this a habit! When anything unusual happens in GP, press ALT+PrtScn. Do it the first time. Do it every time. If you do not capture these important messages, troubleshooting may be very difficult if you cannot reproduce the error.
Using ALT+PrtScn is different than pressing the just PrtScn (Print Screen)–pressing Alt+PrtScn takes a capture of the “active window”.
Capturing the Active Window gets just the error message:
While just PrtScn (Print Screen) captures the entire window:
A screen capture that includes all open applications on multiple monitors can be so difficult to read that it is not helpful.
Then open Word, or an Email, and press CTRL+V (paste).
Types of GP Messages
There are several different “message” boxes that GP can present, and they provide a hint about the issue you are experiencing. Being familiar with these may point you in a direction to find the solution.
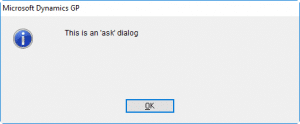
An “ASK” dialog can have up to three buttons on it (such as Yes, No, Cancel). This is an informational message. This is a message coded by the developer, and might indicate setup is missing or incorrect.
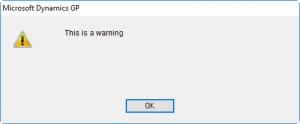
A “WARNING”message has a single button: OK. A warning message may simply be important information (“you can’t do that!”), but it may also be reporting an error. We will look at a warning message presenting an error condition later in this post. A warning message is also coded by a developer, so when it appears you know, at a minimum, it was an event anticipated by the developer.
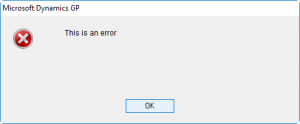
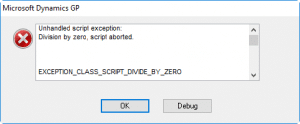
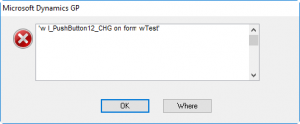
An “ERROR” message is generally more severe. An Error is usually presented when a problem has occurred with a table operation, or some fundamental software error has occurred. It may indicate there is something wrong with the data, or the table storing the data, or in a calculation. A developer can code an Error message, as shown below:
However, error messages are more often system generated:
If possible, scroll down in the error message and capture all of it. If the message has a scrolling window, like the one above, you can copy the text. Click into the message, then press CTRL+A (select all) and CTRL+C (copy). Then paste it (CTRL+V) into Word or an Email.
If the message has another button (i.e. Debug, More Info, etc), click it can capture that information too.
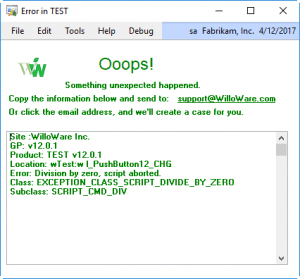
WilloWare uses our own error reporting throughout all products to provide more detailed information.
This window provides the name of the product (“TEST”), the build number, the location of the error, and the cause of the error. The window can also automatically generate a support case by clicking the email address.
Version Information
Depending on where the problem is occurring, you may not be able to even launch GP. The steps below provide several methods to retrieve version information.
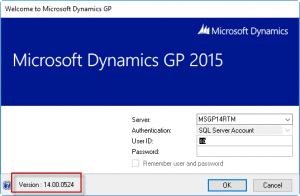
During log-in, the Welcome screen displays the GP version information. This is read as Major Version 14, Minor Version 00, Build 0524.
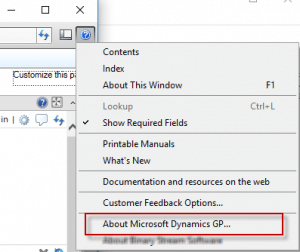
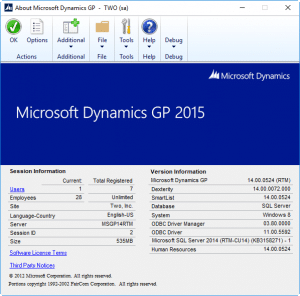
If you can get logged-in to GP, go to Help >> About Microsoft Dynamics GP
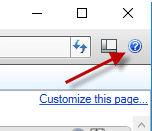
The HELP button is the blue question mark in the upper-right corner
Take a screen capture of this window, and paste it into Word or an email.
Many 3rd Party Products will have “About” navigation on the first menu (where About Microsoft Dynamics GP is located), or off the Additional Menu on the About Microsoft Dynamics GP window.
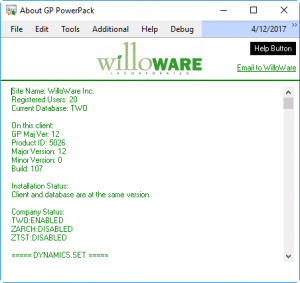
The WilloWare About window (for all products) is off the Additional Menu (i.e. Additional >> About GP PowerPack).
Click into the window, press CTRL+A (select all), CTRL+C (copy), then paste it (CTRL+V) into Word, or an Email.
If you cannot launch GP because it crashes before you can even get to the login window, you can find version information on the application files themselves.
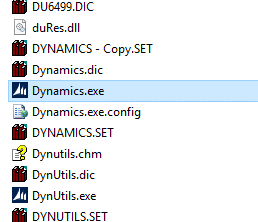
Open Windows Explorer, and navigate to the GP Program Folder. This is usually in the following path:
c:\Program Files (x86)\Microsoft Dynamics\GP2015 (or GP2016, etc)
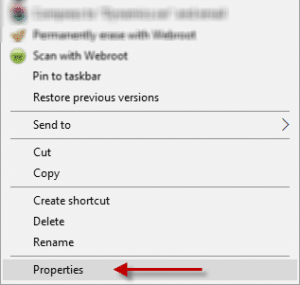
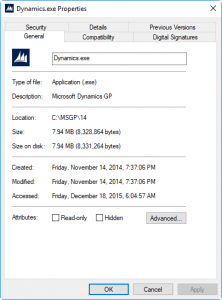
Right-click on Dynamics.exe
The right-click menu can be rather large. Properties is normally at the bottom.
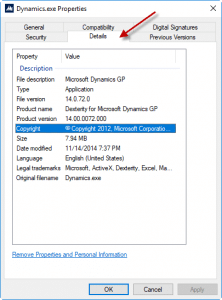
Click the DETAILS tab. Note the File Version/Product Version. This matches the Dexterity Version Information from the About window.
Steps To Reproduce
This might not be safe to do in the live company. See the section in Tools regarding Test Company versus Test Server.
If it is safe to do so, attempt to reproduce the issue. Write down the specific steps needed to reproduce the issue. Think of writing a recipe where ingredients need to be added in a certain order.
What if you cannot reproduce it? Computers are not random, so there is some logic to what happened, but it may not be possible to reproduce the issue. For example, it could depend on a certain number of users all doing the same task at approximately the same time. This would be extremely difficult to reproduce. An issue that cannot be reproduced may not be fixable.
User Specific
At this point you have gathered some information. You have tracked down version information, you may have screen captures, and you have determined how to reproduce the issue. If you cannot reproduce the issue, the following steps cannot be performed.
One of the first troubleshooting steps is to check whether or not the issue is user-specific.
- Can another user perform the same task and get the same error on a different machine? If not, the issue might be related to one User ID and/or computer.
- Eliminate all security issues and test again. Log-in to the computer as the Windows Domain Administrator, then log-in to GP as “SA”. Can you reproduce the issue? If not, the issue is related to security. It could be GP security (i.e. access to windows, reports, etc), or Windows Security (i.e. access to shared files, or appropriate access to the files in the GP program folder). NOTE: you must use the actual account called Administrator to ensure complete access to all computer and network resources.
- Can you reproduce the issue in another Company database (or Fabrikam)? If not, there may be a company setting causing the issue, or a company-specific data issue.
Tools
Test Environment
Test Company or Test Server? See our discussion of this question here:
//willoware.com/install/installation-best-practices/
In a nutshell, a Test Company is a safe place to test transactions. It is usually a good place to attempt to reproduce an issue. However, it is possible to create inter-company transactions, so a Test Company is not necessarily isolated from the Live Company. A Test Server is a separate, replica of the live server. This is a good place to test anything because there is no chance of impacting the live environment.
Log Files
Open Windows Explorer and navigate to the GP Program folder, which is typically:
c:\Program Files (x86)\Microsoft Dynamics\GP2015 (or GP2016, etc)
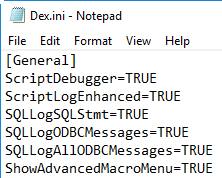
Go into the Data sub-folder. Locate DEX.INI, right-click, select EDIT.
If ScriptDebugger and ScriptLogEnhanced switches not in the file, add them as shown above.
The other “SQLLog” switches are normally in the file. Be sure to check the entire file before adding them.
Set all of the switches shown above to TRUE, then save the file and close it.
Log-in to GP. The SQLLog settings are active immediately and will begin logging. We’ll return to that log file in a moment. The ScriptDebugger setting adds a DEBUG menu to the top of every window, and ScriptLogEnhanced adds a time-stamp to each line in the file.
You want to keep the log files as small as possible so they contain only what occurs when the issue is reproduced.
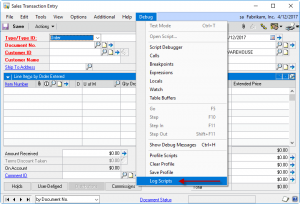
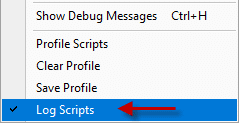
For example, we have found that when we click the “end of file” scrolling button (the right-most scrolling button), we get an error message. The Sales Transaction Entry window is open, as shown above. Go to Debug >> Log Scripts. Save the file to an easy to find location, such as your Desktop.
WAIT! Before reproducing the error, delete the SQLLog file. Use Windows Explorer to navigate to the GP Program folder. In the Data subfolder, locate DEXSQL.LOG. Delete it. Keep Windows Explorer open on the Data folder.
Go back to GP and reproduce the error.
Go back into Windows Explorer and COPY DEXSQL.LOG. This will ensure nothing else gets written to the file. If possible, make a copy of the log file while the error message is displayed in GP.
Returning to GP, you may need to click on several messages before you can get back to the Debug menu to turn off script logging. Go to Debug >> Log Script to disable script logging.
Close GP. Go back to the DEX.INI file and set the logging switches to FALSE.
Save Dex.ini and close the file.
WilloWare’s Consulting Toolkit contains several free SQL Management tools, one of which is the SQL Trace utility. This utility can enable the SQLLog switches discussed above, from inside GP, so that SQL Logging can be enabled/disabled exactly when needed just like the Script Log. Read more about the SQL Trace utility here.
Interpreting Log Files
By copying DEXSQL.LOG at the moment the issue occurs, the last lines in the log file are what immediately preceded the issue. So begin by scrolling to the bottom and working up.
An example from the file:
{CALL TWO.dbo.zDP_CO40100F_1(NULL,NULL)}
TWO is the database, and CO40100 is the table.
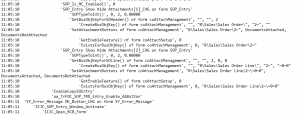
Likewise, the end of the Script Log contains the last steps GP performed before the issue:
The key to reading this file is trying to get a general idea of what is happening without getting buried in the details. For example:
‘SetAttachmentButtons of form coAttachManagement‘, “0\Sales\Sales Order\2~”, DocumentsAttached, DocumentsNotAttached
The bold-red words are dexterity code and everything that follows that is input or output data. From this script we can see that something is happening with Attachments. We can also infer from this that the SQL log might be showing the tables involved in managing document Attachments. Retrieving table information is discussed below.
The time-stamp is useful when troubleshooting a long running process. Watch the time-stamp to see what process takes a long time to run.
Pay particular attention to entries in the script log that look like this:
‘Security’, 0, 2, 116, “”
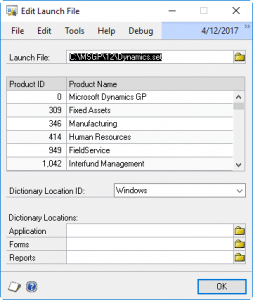
The GP Security procedure checks to see if the user has access to the resource (a window or report). Scrolling backwards in the Script Log until you find an entry for Security can help identify which product is encountering the issue. The red number, in this case zero, is the Product ID. You can connect the Product ID to the Product Name through the Edit Launch File window (Tools >> Setup >> System >> Edit Launch File):
In this case we can see that Product ID = 0 is Microsoft Dynamics GP.
Table Information
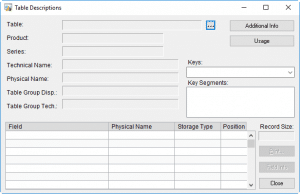
A little known, but very useful tool in GP is the Table Information window. Go to Tools >> Resource Descriptions >> Tables.
Click the … button.
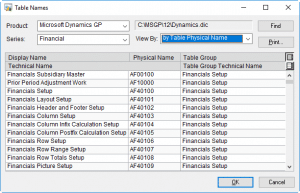
Select the Product (see the “Security” procedure in the previous section), and set View By to “By Table Physical Name”. Tables are grouped by Series (i.e. Financial, Inventory, etc). You can make an educated guess about the series, but sometimes tables are not where you would expect them to be and it requires a bit of searching.
SQL Profiler
SQL Profiler is a component of Microsoft SQL Server and is installed on the server. We are not going to go into depth on how to use Profiler, except to say that the SQLLog file captures information similar to what can be recorded in Profile, but Profile has many more options for what can be recorded and how the information is displayed.
Note the similarities in the Profiler log to the SQLLog file:
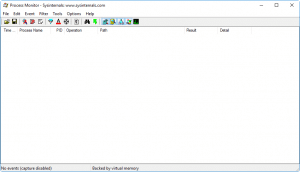
Sysinternals Process Monitor
This tool can be downloaded from:
//technet.microsoft.com/en-us/sysinternals/bb896645
If that link is not available, check www.sysinternals.com for “Process Monitor”.
Process Monitor can report on pretty much everything an application does, from reading Registration Key settings, to internet communication, to file access. It is this last task that can be helpful when there is a security related issue (i.e. there is tight network security and it is interfering with GP).
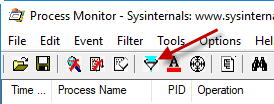
Begin by adding a couple of filters.
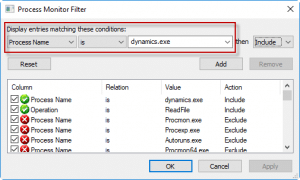
Filter 1: Process Name is dynamics.exe. Click ADD.
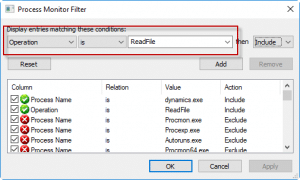
Filter 2: Operation is ReadFile
Click OK to close the window.
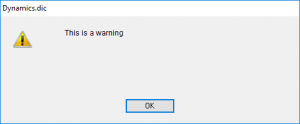
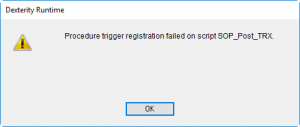
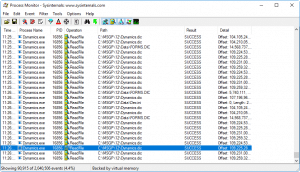
Perform the task in GP that is causing an issue. As an example, GP is generating a warning message shortly after launching the application, before reaching the login window:
As soon as the error appears, stop the Process Monitor. Scroll up from the bottom of the window.
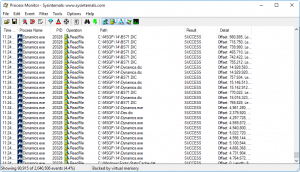
There are a large number of reads on the Dynamics.dic file. An additional filter excluding these file reads would make the display easier to read. Scrolling up in the file we start to see reads from other dictionaries:
In this case, the last dictionary it reads (excluding Dynamics.dic) is BS71.DIC. Using the Edit Launch File window (discussed above), we could identify which product this is. With this type of login error, the next step would be to edit the Dynamics.SET file to remove this product, then relaunch GP to see if the warning disappears.
Editing Dynamics.Set
Editing the SET file should not be done on a terminal server if there are other users in the system (or who could be in the system). It is possible to launch GP using a separate SET file, but that is not covered here.
Dynamics.SET contains a list of the dexterity modules that comprise Dynamics GP. It is located in the GP Program Folder:
c:\Program Files (x86)\Microsoft Dynamics\GP2013 (or GP2015, GP2016, etc)
Make a copy of Dynamics.set before editing it.
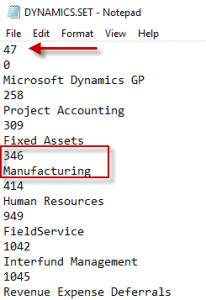
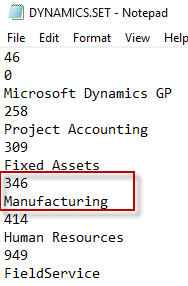
Open it in Notepad. The file has three sections.
- The number of products installed (47)
- The product list (consisting of pairs of Product ID and Product Name)
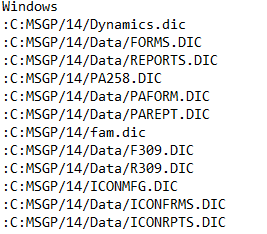
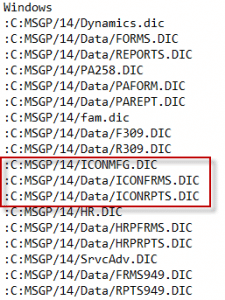
- The pathnames list below the “Windows” line (consisting of three lines per product, list the path to the application dictionary, forms dictionary, and reports dictionary)
The forms and reports dictionary files are only present if a window or report has been modified.
To remove a product from the SET file, decrease the product count by one, remove the two lines that identify the product, and remove the three pathname lines for the product.
To remove Manufacturing from this SET file, the product count could be 46.
Remove the two lines highlighted above, leaving no blank rows (Fixed Assets should be followed by 414).
Remove the three lines highlighted above, leaving no blank lines between “R309.DIC” and “HR.DIC”.
Save the file.
An often overlooked troubleshooting tool is Google. Search for the error message, or the window involved and include the word “error”. If you have done some of the troubleshooting steps above you may have additional information such as a table name, or a script name from the script log.

